Visualizing the FPL histories of entries
Rasmus Wiscostretford
2021-08-14
Source:vignettes/vizentryhist.Rmd
vizentryhist.RmdSuppose now we are interested in visualizing the FPL history of two entries.
First we fetch the entry histories of two random entries using get_entry_hist:
library(fplscrapR)

entryhist <- get_entry_hist(entryid=c(1001,2002))
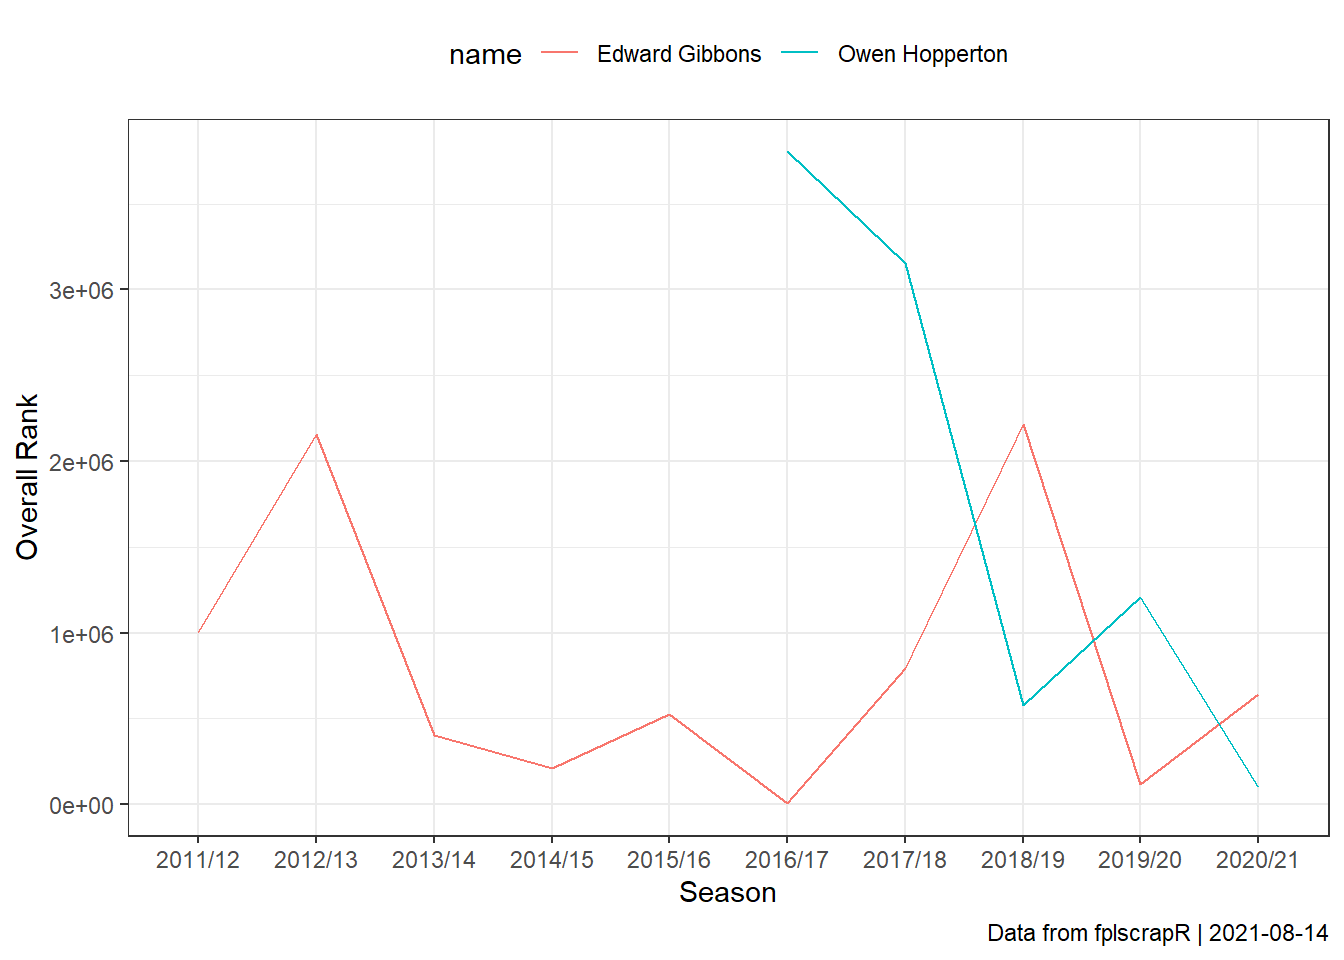
Next we plot the historical performance using dplyr and ggplot2:
entryhist %>%
  ggplot() +
  geom_line(aes(x=season_name,y=rank,group=name,colour=name)) +
  theme_bw() +
  theme(legend.position="top") +
  labs(x="Season",y="Overall Rank",caption=paste("Data from fplscrapR | ",Sys.Date(),sep=""))